Have you ever tried to draw a sine wave and it has been harder than what you thought? This example shows how to create a sine wave that can have its parameters changed at runtime and then the updated version of the wave can be seen in the program.
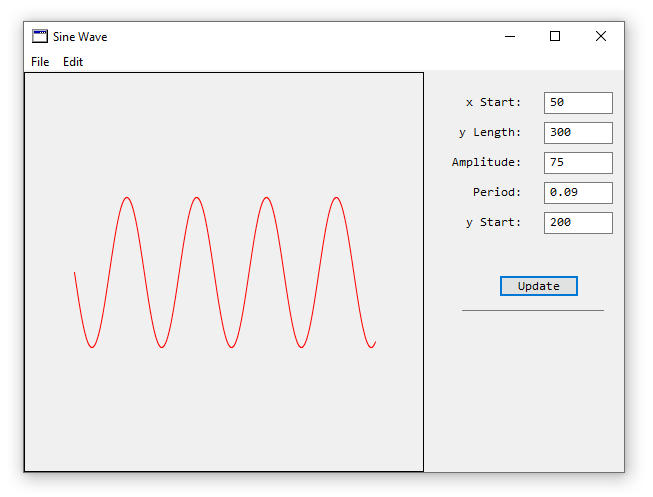
Figure 1. Screen grab of running program

The formula for generating a sine wave is y = A*sin(B(x-C))+D. Where A is the amplitude of the wave, B is the frequency of the wave, x is the x-axis value, C is the y-axis shift, and D is the vertical shift. This is good when calculating values on a piece of paper, and it becomes a little more challenging when doing this in a computer program.
Drawing with pixels can be a little tricky, and to make it easier for longer waves, the example uses drawing a line instead, which has the added benefit of preventing spaces between points on a wave. The method which makes the math and drawing concepts work is called DrawWavyLine.
| Public Sub DrawWavyLine(g as Graphics, XStart as Double, YLength as double, Amp as double, Period as Double, YStart as Double) //y = asin(b(x-h))+k //a = amplitude, b = period, h = horizontal shift, k = vertical shift, x = x-axis //XStart=Starting pixel coordinate on x-axis //YLength=Total length of the wave in pixels //Amplitude=Height of the wave from the middle to top of the wave in pixels //Period=Length of the repeating wave(not sure of the units and is a function of sine) //YStart=Starting pixel coordinate on the y-axis Dim i as integer For i = 0 to YLength g.ForeColor = RGB(255,0,0) //Red g.DrawLine(i+XStart, Amp*sin(Period*(i))+YStart, i+1+XStart, Amp*sin(Period*(i+1))+YStart) Next i //Draw a border g.ForeColor = RGB(0,0,0) //Black g.DrawRect(0,0,g.Width, g.Height) End Sub |
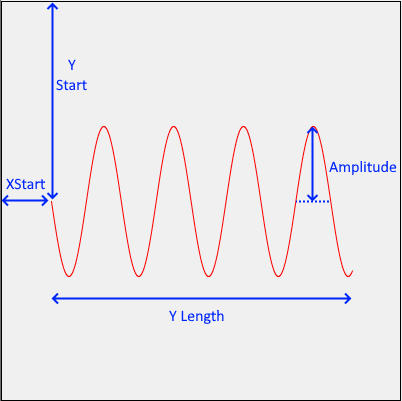
A For-Next loop will repetitively go through each point in the wave through its entire length. DrawLine is a method built-into Xojo and draws a line from X1,Y1 to X2,Y2. To shift the starting point of the wave, the XStart value is added to the X1 and X2 values. Calculating Y values implements the wave amplitude (amp) the sine of the period (kind of frequency) and the value in the loop. YStart is the y-axis offset of the sine wave graph.
Figure 2. Sine Wave Parameters

There are five labels and five textbox controls added, along with a button. Initial values for each of the five textbox controls have been added so that a wave will appear when the update button is pressed. Code in the update button is one line.
|
Sub Action() Handles Action //update the Canvas Canvas1.Invalidate End Sub |
Drawing in a Canvas control should occur in the Paint event, and the code is shown below.
|
Sub Paint(g As Graphics, areas() As REALbasic.Rect) Handles Paint Dim XStart1, Y1, YStart1, Amp1, Per1 as Double XStart1 = Val(TFX.Text) Y1 = Val(TFY.Text) Amp1 = Val(TFAmplitude.Text) Per1 = Val(TFPeriod.Text) YStart1 = Val(TFYStart.Text)
Call DrawWavyLine(g, XStart1, Y1, Amp1, Per1, YStart1) End Sub |
Five double-type variables are created and values from the respective textfield’s are converted to a numerical value from a text value by using the Val method. DrawWavyLine is then called with the updated values and a sine wave is shown.
Here is the example Xojo project that you can have fun with the code. Github Sine Wave Horizontal Xojo
Here is the example C++/CLI example project Github Horizontal Sine Wave C++/CLI
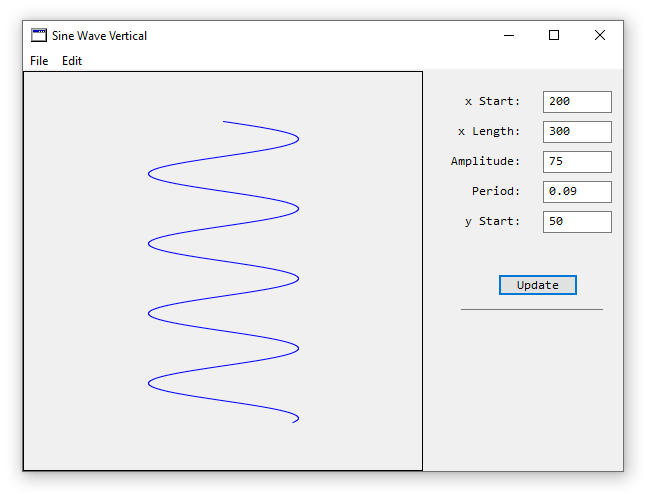
A method was also created to make a vertical sine wave, and a modified version of the program makes the following wave.
Figure 3. Vertical Sine Wave

The Xojo program for drawing the vertical sine wave can be downloaded here: Github Vertical Sine Wave. Code for the example is very similar, and the following method is where drawing happens:
| Public Sub DrawWavyLineVertical(g as Graphics, XStart as Double, XLength as double, Amp as double, Period as Double, YStart as Double) //y = asin(b(x-h))+k //a = amplitude, b = period, h = horizontal shift, k = vertical shift, x = x-axis Dim s as RGBSurface Dim i as integer For i = 0 to XLength g.ForeColor = RGB(0,0,255) //blue g.DrawLine(Amp*sin(Period*(i))+XStart, i+YStart, Amp*sin(Period*(i+1))+XStart, i+1+YStart) Next i //Draw a border g.ForeColor = RGB(0,0,0) //black g.DrawRect(0,0,g.Width, g.Height) End Sub |
| This example was created on Windows 10 with Xojo 2019 r1.1 on 26 June 2019, and edited on 28 June 2019 |

